


Numbers are great because they’re revealing and they never lie. Here are some extremely useful SaaS metrics you need to calculate to make better corporate decisions and find product/market fit:
1 – Sales Velocity
Sales velocity is a really important SaaS metric and somewhat overlooked. Simply put, if we break the name into two part: Sales velocity is basically a measurement on how fast you’re making money in your organization. The four factors to be considered are:
- Number of opportunities(L): Leads that are qualified to buy your product
- Average deal value(DV): More description is given below, check ARPU
- Closed/won or win rate(WR): The % of deals you win on average
- Sales cycle length(T): The time in days it takes to close a deal
The formula:
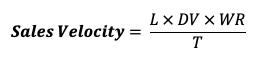
So, what do you do now? The formula tells you how much money your sales team is bringing in each day. Let’s say your quota this month is $30,000 and your sales velocity is roughly $800 per day. This means there’s a problem. As $800 per day * 30 = $24,000 , there’s a $6000($30,000-$24000) deficit between your quota and Sales velocity value. In this case, you need to look back at the four factors above or question your quota altogether. Whatever the case, at least you have identified a practical issue before things get too late.
2 – Monthly Customer Churn Rate
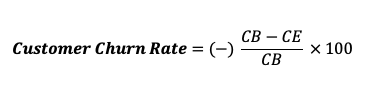
Churn is a very popular SaaS metric which simply tells you how many subscribers you’re losing every month. Let’s look at the numbers you need to calculate churn:
a. The number of customers lost= The number of subscription-based customers you lost in the given month. Calculation = Number of customers at the starting of the month(CB) – Number of customers at the end of the month(CE)
b. Numbers of customers at the beginning of the month(CB)
For example:
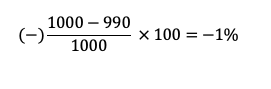
If you start off with 200 customers and now at the end of the month you have 190 customers your churn rate would then be:
This simply means that on average your losing 1% of subscribers each month. Keeping a track of churn is important. You can also add up 12-month differences in customers to find annual churn too.
3 – Average Revenue Per User (ARPU)
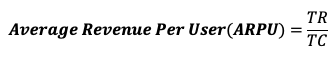
On average, how much money does a subscriber pay you? ARPU is all about answering this critical question:
Total Revenue (TR): The revenue you’re earning from your subscribers in the given time frame in $ value
An average number of customers(AC): We use average subscribers because the actual number of subscribers can change constantly.
For example:
Company X generated $1 million in revenue last month and the average number of subscribers during the month was 60,000. Then, the ARPU could be calculated as:
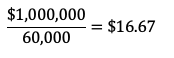
It’s great to know this stat so you can plan your upselling and re-targeting strategies as well.
4 – Monthly Recurring Revenue (MRR)
Creating a predictable pipeline is the ultimate goal any business can attain. However, you need to know what your customers are consistently paying you on a monthly basis. This a powerful yet very simple stat to calculate. You need the following information:
ARPU: All calculations and explanations above!
Customers in any given month(CM): Customer numbers fluctuate so simply choose a given month to calculate
![]()
For example:
If you have $16.67 ARPU and a 1000 customers in the month of January then your MRR is simply:
$16.67*1000 = $16670
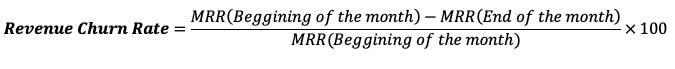
5 – Revenue Churn Rate
Revenue churn rate runs parallel to customer churn rate. It shows you the benefit some customers may give you over others for e.g. since subscription price varies from customer to customer it is best to see who is generating most revenues and break them down semi-annually or quarterly.
For example:

A -8.1% revenue churn is not so good. Correlating your revenue churn with your customer churn rate is important.
6 – Annual Recurring Revenue
Annual Recurring Revenue is just like MRR – but it gives you a picture of the entire year as opposed to a single month. It is calculated by:
![]()
Therefore, continuing the previous example:
![]()
7 – Customer Lifetime Value
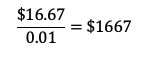
Another SaaS metric is customer lifetime value which tells you the amount of money your customers are paying. This is an important metric because it helps in projecting your company’s worth to competitors and potential customer. If your monthly churn rate is 1%:
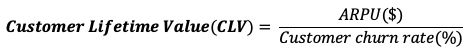
This translates to:
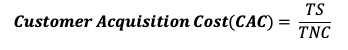
8 – Customer Acquisition Cost
Customer acquisition cost (CAC) shows exactly how much it costs to acquire new customers and how much value they bring to your business.
When combined with customer lifetime value (CLV), this metrics helps companies determine how viable their business model is. For this stat you need to know:
- Total spend on acquiring new customers(TS): This can include spending on sales, marketing, and revenue operations in a given time period
- Total number of new customers acquired(TNC)
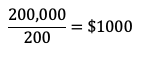
For example, if you’re spending $200,000 to acquire 200 customers, then results will be as follows:
9 – CAC-to-LTV Ratio
This shows the lifetime value of your customers and how much you spend to acquire them. It also displays the health of your marketing program, so you can invest in better programs if needed and make changes accordingly.
Finding this is fairly easy- compare your CLV and CAC. A good and healthy business should have a CLV that is at least three times greater than its CAC. Any lower (e.g., a 1:1 ratio) means you’re spending too much money. If it’s higher (a 5:1 ratio) it means you’re spending too little and missing out on potential business.
10 – Gross Margin
This is an old school calculation that you need. Good Gross margins are anywhere between 40-60%. You can calculate gross margin with a simple formula:
(Total sales- the cost of sales)/ Total sales* 100
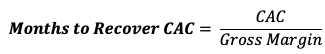
11 – Months to Recover CAC
By this SaaS metric we mean your return on investment – essentially, how soon you can recover the customer acquisition cost. This number should obviously decrease over time so you get your revenue over shorter periods as your business grows.
The formula would be:
12 – Targeted Traffic
As a SaaS business, you have a dashboard so you know each time your customers log in. However, you need to differentiate between website traffic and your regular customers who re-visit. By using event tracking, you can count each time a customer is on the log-in screen and how often they do it in a month. Hence, these will be your actual customers as opposed to just qualified marketing traffic.
13 – Leads by Lifecycle Stage
This SaaS metric is quite helpful for monitoring customers. It determines what buying process stage your potential customer lead is in. You need to have a sales or marketing funnel in place and what best then to use a CRM to see how many leads you have at which stage. Stages like:
Awareness: Top of the funnel “leads”
Interest: Qualified leads or leads that have the ability to buy
Decision: Interested leads that are now in the decision-making process(you’ve sent your quote or proposal)
Action: leads that you’ve Closed/won or Closed/Lost with reason
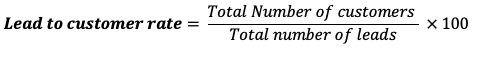
14 – Lead-to-Customer Rate
When we talk about driving sales, the lead-to-customer rate shows you many leads actually turn into paying customers. Since driving sales is your ultimate goal, this is one SaaS metric your marketing and sales team should be on top of. What’s more, lead-to-customer rate it is quite easy to calculate.
For example:
15 – Customer Engagement
Measuring and tracking your customer engagement levels provides some excellent insights into your customer’s activity. For e.g. how often they log in daily and exactly which feature in your software they are engaging with. Customer engagement score hence shows you their satisfaction and dependency on your software. Set a benchmark and measure how often your most loyal customers use specific features to understand what to improve and wen. This can also help you drive your marketing activities – for example, if your customers are not using a specific feature of your software, you can engagement through video and email guides about the benefits of using that specific feature.
16 – Customer Health Score
As the name suggests, the customer health score shows you the customer-business relationship and whether it is at risk. This requires uses a customer service tool and assigns different values to different types of customers depending on their behavior patterns. This additionally helps in determining the customer churn rate.
17 – Average Sales Capacity
Whether we admit it or not sales will always be a numbers game. You need to create a benchmark on how many dials/emails or touchpoints you need per day to get an opportunity. Some organizations have a minimum of 70-120 dials per day others have fewer dials but multiple touchpoints. Either way, you need to create a process to understand the capacity your average salesperson can handle.
18 – Viral Coefficient
This SaaS metric determines how many new customers your current customers bring in to the business. It is calculated by multiplying the average number of referrals/invitations by a user into the percentage of the users who actually converted into customers. The higher this number, the better your growth rate:
VIRAL COEFFICIENT=Average Number of Referrals x Conversion Rate
For example:
Company X started with 100 users and gained 120 users. Divide the number of new users by the number of existing users to find your Viral Coefficient
VC= (120 / 100 = 1.2)
19 – Runway
Keeping an eye on your cash reserves is very important. Each month, your cash flow naturally fluctuates. A SaaS metric to track this is to calculate your runway – or in other words, keep a check on how long you will be able to sustain your business activities with the cash you have and your ‘zero’ cash date (the dreaded date when you are projected to run out of out cash). This is calculated by:
RUNWAY= Cash Balance / Net Burn
For example:
Company A’s balance is $180,000 and the net burn rate is $10,000 per month so;
RUNWAY= $180,000 / $10,000 = 18 months
20 – Net Cash Burn
Alongside Runway, you should monitor the rate at which your business is burning its capital against the revenue being generated, including the time it takes to generate it. This is calculated by:
NET CASH BURN=Gross Burn – MRR
If this value is positive, it means you are spending more than you are generating in terms of revenue.
BONUS: Net Promoter Score (NPS)
Net Promoter Score (NPS) is a SaaS metrics which measures the likelihood of a customer promoting and recommending your product to another. This is can be estimated from carrying out customer satisfaction surveys where they rank your product on a scale of 1-10.
- Those who score between 0-6 are classified as Detractors
- Those who score 7-8 are called Passives
- Those who score 9-10 are Promoters
A good strategy is to award customers who score higher with access to exclusive for x number of days, early access to new features etc. This essentially helps you retain your customers for longer, builds customer loyalty and encourages them to recommend your software to other people.